In a previous article, Finishing Skill and Its Effect on Expected Goals, I used data from the 2017 season to explore shots in MLS, and the effect the number of shots on target could have on xG. That was a small sample size, but the preliminary findings were interesting. There does indeed seem to be a relationship between how good a player is at getting shots on target, and whether or not he over/under-performs his xG. I'll dig a bit deeper into it in this and a later article.
As I did last time, I used the xG Ineractive Tables from American Soccer Analysis. An excellent and free tool to explore this type of data, so a big thanks to them. This time I expanded to include the last three seasons, but did not include PKs. Nor did I split players at all or set a minimum shot requirement.
That produces a decent data-set of 729 players taking 26 338 shots and scoring 2 681. There were 9 013 shots on target (34.2%), which means that 29.7% of those particular shots found the back of the net. It' also worth noting that the expected amount of goals from this data-set was 2 649, which is pretty close. The overall efficiency was 1.01, about what we would expect from a good xG model.
Annonse:
A couple of things stand out when investigating this data, particularly the averages. The mean number of shot per player was 36, the median 17, and the mode 1. Not exactly bell shaped. It also means that most players take very few shots, but there are a lot of those players! In fact, splitting the players into two groups that have taken roughly equal number of shots in total, requires splitting between 80 and 81 shots. 13 059 shots were taken by the 93 players with 81 or more shots. Which means that the remaining 13 279 shots were taken by 636 players with 80 or fewer attempts.
Now this is interesting, as we would expect the first group with lots of shots to be players that are paid to be good at shooting. They should be better than the second group. And they are. First off, their combined xG was 1 420, compared to just 1 229 from the group with fewer than 80 shots per player. So they should score 191 more goals just from taking their shots from better chances. But they scored 329 more. Big difference. The efficiency was 1.06 in the many-shots group, compared with 0.96 from the other. So better chances and better finishing.1Both xG per shot and goals per shot were statistically significant between the groups using the chai square test.
Which brings me back to shots on target. Is there a difference between those groups, and can that help explain the difference in efficiency? The answer to the first question is a resounding yes. The 81+ shooters hit the target 4 874 times (37.3%) while their compatriots only hit it 4 139 times (31.2%). Over 700 more shots where goalies were forced to make a save! Let's just make the assumption that 70% of all shots on target are stopped. That would mean 200 extra goals just from being able to hit the target. Even here the 81+ players did better, scoring on 30.9% of shots on target, while the others scored on 28.4%. The total tally; 1 505 goals versus 1 176 goals.
Based on that, it seems safe to conclude that a lot of those extra goals came simply from hitting the target more often. Comparing these two groups, the group where each player took a lot of shot had about 18% higher xG per shot, 20% higher OT%, and 30% more goals per shot.
Individual level
Annonse:
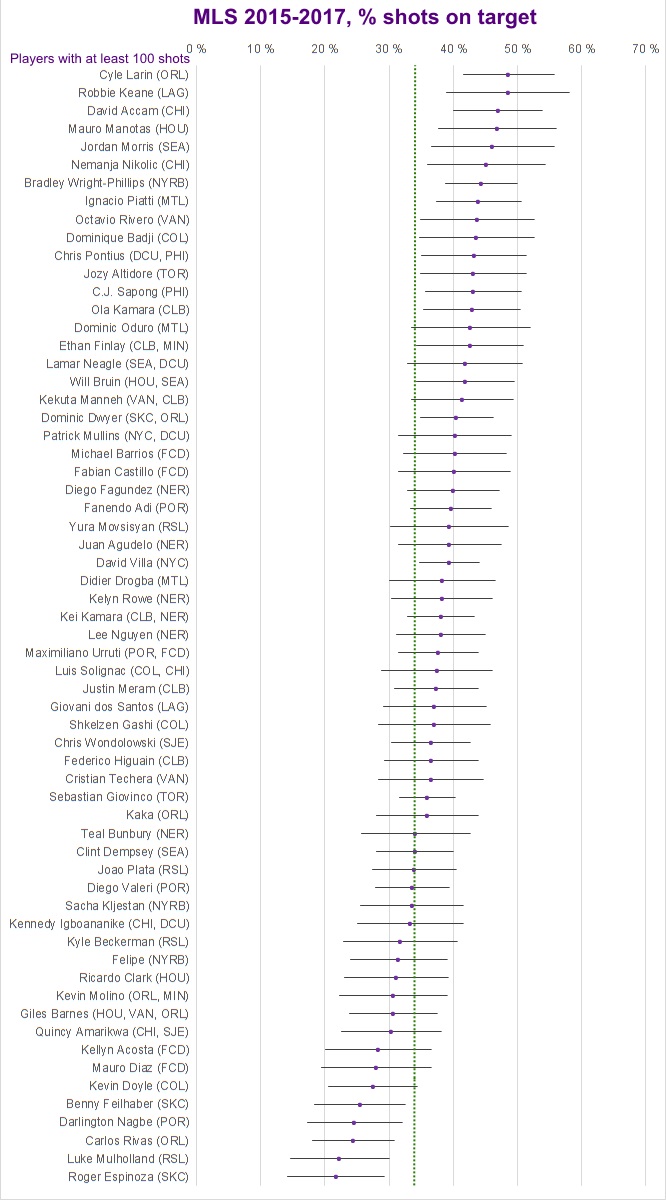
So now that we have established that being able to get shots on target seem to produce more goals than expected, are there players that are better at this than others? With data from three seasons, there is enough information to look at individual players. In the graph below, I have sorted players from highest to lowest on-target percentage. In addition, the 95% confidence interval is included, and we can indeed see that some players are either above or below average finishers.

It's worth mentioning that all of these players were in the "best" half from the initial analysis. Yet there are some stark differences. Cyle Larin is on-target almost half the time, while his Orlando team-mate Carlos Rivas is less than half that again. Rivas has hit the target on 42 of 172 shots, Larin has scored 43 on 191 shots. And yes, Larin is over-performing his xG while Rivas is the opposite.243 goals on 32 xG, compared with 8 goals on 12 xG.
So further slicing will be done in the next article, where I'll focus on above-average, around average, and below-average finishing skills as measured by the ability to get shots on target. How does that correlate to the ability to score more or less as expected?