The concept of Expected Goals (xG) has been around for quite a while, and xG maps add value when analyzing a game. One thing that I would like to see in these maps though is the relationship between expected goals and clean sheets. Specifically, what was the chance of a team having a clean sheet based on the chances created.
While some models use the Poisson distribution to predict the chance of a clean sheet in the next game, these are based on the aggregated xG. What I'll be arguing in this article is calculating the clean sheet probability based on actual chances conceded.
Annonse:
Method
For each shot taken, various xG-models produce a probability that the shot will result in a goal. Since shot outcome is binary - you either score a goal or not - it is very easy to calculate the probability that the same shot will not result in a goal. Let's call this xNG.
As the sum of xG and xNG always has to equal 1, then xNG = 1 - xG. A team conceding one shot with an xG of 0.15, has a chance of a clean sheet of 1 - 0.15 = 0.85, or 85%. Should the same team give up two of those chances, the probability of a clean sheet is the probability that both shots are missed. xNG1 * xNG2, in this case 0.85 * 0.85 = 0.7225.1Treating each scoring opportunity as independent of each other. Since a clean sheet requires that no goals be scored, the probability is simply the product of all xNG in the game. Fairly straight-forward and easy to calculate.
Theoretical Case
Part of the background for this article is Mark Taylor's article about the difference between a few big chances and multiple small ones. Here he shows that a team with two big chances with an xG of 0.6 (Smith United) has a 37.5% chance of winning over a team with twenty chances with xG of 0.06 (Pot Shot FC). Even though the cumulative xG is the same for both teams. A few high quality chances are better than many small ones.
This becomes very obvious once expected goals and clean sheets are considered. The xNG for Smith United is 0.4, which means that Pot Shot FC has a clean sheet probability of just 16%.20.4^2 = 0.16 On the other hand, the xNG of Pot Shot FC is 0.94. Each one should be relatively easy to stop. Indeed, the probability that Smith United manages to keep a clean sheet is 29%.30.94^20 = 0.29.
That's almost twice as much as their opponent, even with the same total xG conceded!
Real Life Example
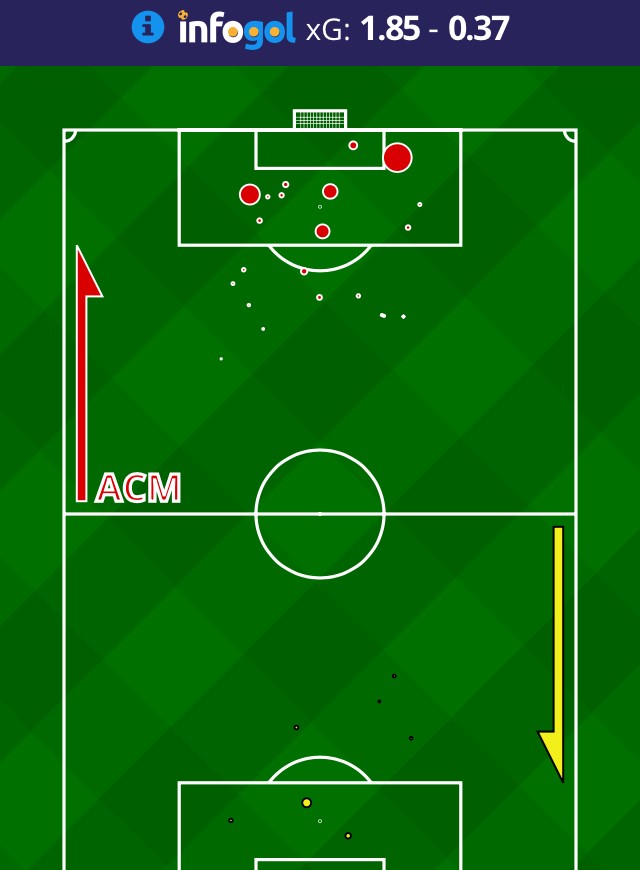
Let's consider the UEFA Europa League match between AC Milan and AEK Athens on October 19th. The match ended 0-0and below is the xG map as produced by the infogoal-app.

Just looking at the map you can tell that AC Milan produced the most and biggest chances. With a total xG of 1.85, they probably should have scored. Using the method described above, there was just a 13% chance that AC Milan would be shut out. On defense, they limited AEK Athens to just a few low-quality shots. There was indeed a 68% chance that they would have a clean sheet.
In fact, AC Milan's biggest chance had the same xG as the total of all Athens'. The xNG of Suso's attempt was 0.63, again illustrating the difference between one big chance versus multiple small ones.
Annonse:
Using Expected Goals and Clean Sheets
So what's the purpose of this? For one, it would add valuable information to any xG map. Second, it would illustrate the degree of luck involved in keeping a clean sheet. I would also argue that it would give valuable insight if average clean sheet probabilities were included in statistics. Is a defense good at limiting the opposition to crappy shots, or do they regularly mess up? Same on offense, do you shoot recklessly or create fewer but better opportunities.
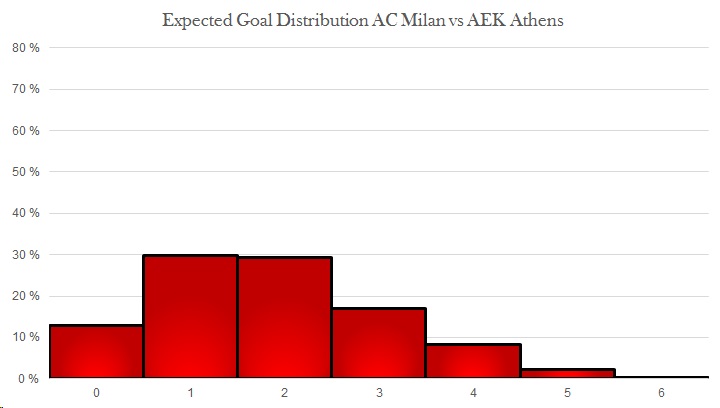
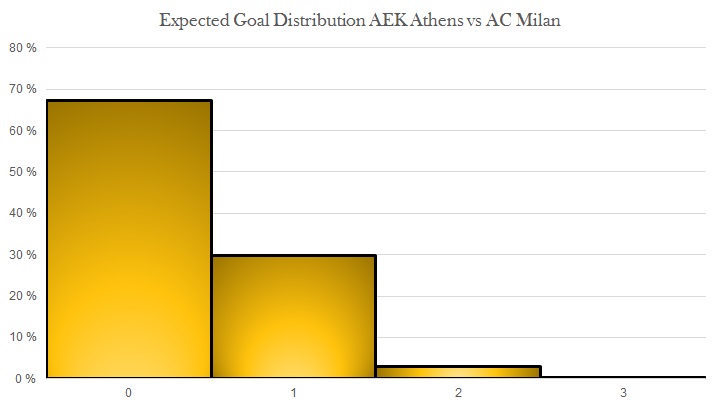
This could of course also be extended to creating an expected goals distribution from the same game. While these should look like Poisson distributions, in some cases they will not. Below are simulations of expected goal distribution for both AC Milan and AEK Athens based on the chances created. Based on these chances, AC Milan were expected to win 75%, draw 21%, and lose only 4% of the time. This is similar to what 11tegen11 produces for their xG-plots.4That model had slightly different xG, which is why the probabilities are somewhat different.


In conclusion; using expected goals to calculate the probability of clean sheets would add real value to match analysis. It's an easy calculation, producing a single number, giving a quick insight. This might be incorporated into next year's prediction model for the Norwegian Eliteserien.