There were a few Eliteserien prediction models for the 2017 season, including the one on this site. Now that the season has ended, it's time to evaluate these models and see how well they did.
The models I’ll be comparing are our own ELO-model, the FiveThirtyEight Club Soccer Predictions, as well as the betting odds of Betsson. Yes, betting odds are predictions, even though their main goal is to make money and not guess the correct outcome. To go from odds to probability, I take 1 and divide by the odds for each of the outcomes of a match to get an raw probability. This usually adds up to more than 1 (the house needs a cut), so to get the model probability I take the raw probability of each outcome and divide by the sum of the probabilities for the match.
Before I dive into the evaluation, I’ll compare and contrast the models a bit and then do a summary of the season. As described, the betting odds aren’t mainly trying to predict the match outcomes, but in order to make money they have to predict fairly accurately. The Analytic Minds ELO-model (AMELO) uses past data about wins, draws and losses to predict the outcomes and is specifically developed for Eliteserien. The FiveThirtyEight model is part of a bigger project for club soccer predictions across a range of different leagues, with no special consideration for specific conditions in Eliteserien.
The season ended with 118 games won by the home team, 63 by the away team, while 59 games ended in a draw (49.2%, 24.6% and 26.3%). This is more or less in line with the historical average over the last few seasons, with a small increase in home-field advantage.
Now for the evaluation itself. I’ll be using two approaches; Ranked Probability Score (RPS),1As described in Solving the problem of inadequate scoring rules for assessing probabilistic football forecast models by Constantinou and Fenton. as well as the area under the curve (AUC) of the receiver operating characteristic (ROC) curve.
RPS basically measures how close your predictions were, and punishes the model more for predicting a home win than a draw if the game was won by the away team. Say one model predicted a 50% chance of home win, 20% of draw and 30% chance the away team would win, while a second had 20%, 50% and 30%. Since the away team won, the second model will score better because it was closer to being a drawn match than a win for the home team. (The first model would have an RPS of 0.37, while the second would have 0.265. The closer to 0 the better the model).
The ROC on the other hand, basically ranks the predictions and measures how well it identifies the correct outcome. This creates a curve, and the larger the area under that curve, the better the model is at distinguishing between high and low probability events. Basically, a 70% probability event should happen more often than a 50%, which in turn should happen more than 20% probability event.
RPS
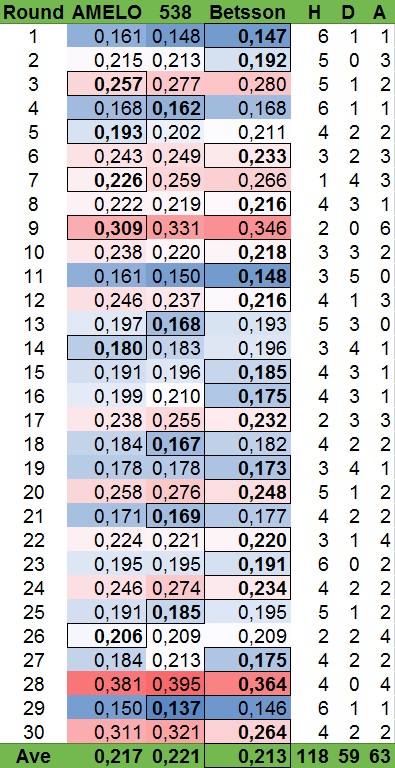
In the table below I have listed the average RPS per round, as well as the average of all matches. In addition, I’ve listed the game outcomes of each round. The scores are color coded with blue being good scores and red bad. Each round's "winner" is highlighted and with a border.

As can be seen, Betsson “won” 60% of the rounds and also had the lowest average. The remaining rounds were split between AMELO and FiveThirtyEight, although AMELO ended up with a lower score overall. Most of the time the two models were close, and they each had the lower score in half the matches. The game with the single biggest difference was the July 9th game between Stabæk and Brann. AMELO set the probabilities at 31.4%, 26.7% and 41.9%, while FiveThirtyEight were more bullish on Brann and had 21%, 21% and 58%. The game ended 2-0 Stabæk, which resulted in an RPS of 0.323 for AMELO and 0.48 for FiveThirtyEight.
It also makes sense that a betting company would perform the best out of these models, as each game is carefully analyzed and real money is on the table. The other two models are algorithms that do not adjust for single game factors. This is particularly evident in the last round of the season, where Betsson performed much better than the others. Particularly with respect to Sogndal-Vålerenga, where Sogndal was fighting to avoid relegation while Vålerenga had nothing to play for. Betsson had Sogndal at 51.8% chance of winning, while AMELO had 35.2% and FiveThirtyEight 31%. Sogndal won 5-2 to get a new chance at securing a spot in next season's Eliteserie.
ROC

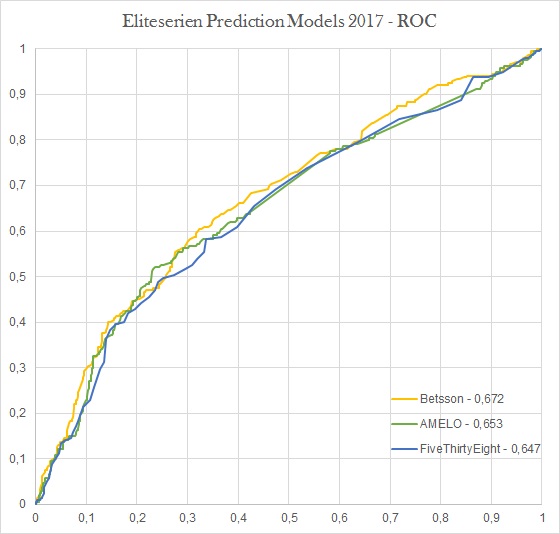
Once again, Betsson won comfortably with an AUC of 0.672. This time, FiveThirtyEight (0.647) were much closer to AMELO (0.653), once again indicating that the models were fairly close. AMELO's small advantage mostly happened in the range where the predictions were between 30% and 40%, while they tracked each other almost perfectly the rest of the time.
In conclusion, of the Eliteserien prediction models in available for 2017, the betting company made the most accurate one. Of the two remaining models, the ELO-based one outperformed the offensive/defensive rating one. While I'm extremely happy with that, it should be noted that AMELO is optimized for the Norwegian league, while the FiveThirtyEight one is not. It will be interesting to see how these perform in 2018, and if there will be other models as well. This season, KroneBall had a model that was active for half the season, while OddsModel published overviews and predictions for certain games. We will see what happens in 2018.